This project aims to understand how mental health is viewed in the Tech industry, the spread of mental disorders among the employees and to gauge the system present to tackle these conditions. D3 based visualizations based on the survey results of 3 different years will be implemented to gain a multi-faceted view of our data. These designs would be beneficial to the current employees of the Tech industry, the companies themselves and the external organizations that work for the cause of mental well being in the IT industry. Insights gained through these visualizations would serve as a feedback to the entire system and thus would be highly beneficial to all the key stakeholders.
Introduction
In the present times, the IT industry is responsible for providing employment to a vast population of the United States. Mental well being of the employees of such a large sector is of utmost importance. To understand the current scenario of mental health in the IT industry, we have referred to the OSMI Mental Health Surveys of Tech Industry. On visualizing these survey responses and drawing meaningful inferences, the stakeholders could gauge how the entire support system for mental health is performing and whether it can be improved further.
Data & problem selection
The Open Sourcing Mental Illness (OSMI) community runs large scale surveys in the Tech industry to gain an understanding of how mental health disorders are viewed in the industry, what provisions and resources are made available by the employer and how effective the entire system is. Each of the surveys consists of about 1500 responses from the employees of the Tech industry that would help the users understand the current employees opinions about how mental health conditions affect the workplace environment.
We have used survey results for the years 2014, 2016 and 2019. This forms an extensive base for us to understand the current statistics of the Tech industry and find corresponding trends and correlations too. The data will be pre-processed to make it adaptable for the visualizations. The visualizations are aimed to be interactive and provide multiple views of our survey data. Being in the field of Computer Science, this problem motivates us to understand how mental health is viewed in the IT industry and understand the trends changing over years.
Along with answering basic questions like demographic distribution of disorders, the visualizations could also help understand subtle nuances like:
- Relation of employee anonymity with perceived consequences of discussing mental disorders.
- Effect of employee’s family history of illness on their willing to reach out for help.
- Relation of company size with availability of mental health resources.
- Factors to be considered while evaluating company support for mental health well being.
General Data Statistics
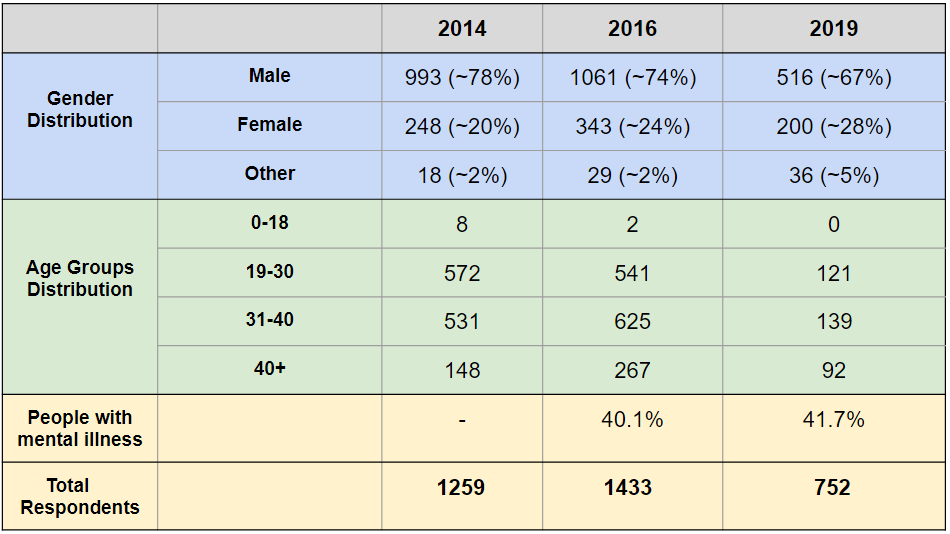
The table shows general statistics about the dataset for all 3 years (2014, 2016 and 2019) that we have chosen. The chart below that shows a distribution of different mental health disorders among the survey data participants.

Demographic Views
Statewise Distribution of Disorders
This visualization shows the statewise demographic spread of the top 3 mental disorders faced by the employees of the IT industry. Mood, anxiety and attention deficit hyperactivity disorders are the most commonly faced illnesses among the employees and a bar chart shows the number of cases of these disorders for each state. The tooltip shows the percentage of people suffering from mental illness in that state and year-wise spread can be viewed using the timeline slider.
The current employees of the industry could use this design to check for trends in each state which might be useful for future job perspectives. The state mental health volunteers could use this design to gauge the situation of mental well being in their state and suggest required changes.
Key Inferences/Insights:
- Tech hubs like California, Washington and New York have the largest section of employees with mental disorders, which shows the overall stressful nature of the tech-industry.
- Mood Disorder which includes depression, bipolar disorder etc is the most commonly faced mental disorder within all states over the years
Suggestions: Mental health volunteers working for this cause can address the issue of mood disorder, and suggest solutions to the companies by analyzing viable options to mitigate its effects.
Illness Family History vs Willingness to discuss with peers
This visualization shows how having a family history of mental illness affects the employee’s willingness to discuss their mental health situation with their peers. Gender based division is also made to better understand the changing trends within the genders. Sunburst diagram is an efficient way to show the inherent hierarchy of this design, and each response in the outer circle is accompanied with the trends of that response changing over 3 years.
The company representatives could refer to this visualization to gain a better understanding of the reservations faced by the employees to open up about their problems. The mental health volunteers could also use the results to analyze the effects of family history and suggest ways for employees to open up about their problems.
Key Inferences/Insights:
- Over the years, the tendency to open up about discussing mental illness has increased.
- People with family history of mental illness are more willing to reach out for help
- Employees without a history of illness show more reservations in opening up about it
- Men were found to be more willing to discuss their mental health
- Over years, females are now more willing to discuss their mental health
Suggestions: The company can organize counselling sessions for their employees, especially for the ones with no family history of illness so that they feel comfortable discussing their issues and finding the solutions. Moreover, even among the ones with family history of illness, there is still a large section of people who are not willing to discuss their issues, which makes it imperative to hold counselling sessions for the same.
Employee mental state while discussing mental health
Anonymity vs perceived consequences
Protection of anonymity plays an important role in the way employees perceive there to be negative consequences attached to revealing their mental health issues. This correlation can be understood from the visualization given below. The bar chart shows the employee’s perceived consequences against the status of anonymity protection in their respective companies. The heat map associated with each bar gives a better understanding about these correlations. The dropdown helps the user navigate between the perceived consequences of the both mental and physical disorders.
This visualization can be used by the company representative/HR teams to modify or formulate their anonymity policies that best suit their employees comforts in opening up about their mental illnesses.
Key Inferences/Insights:
- Protection of anonymity plays a big role in how people percieve there to be negative consequences of discussing illness. Employees who think that anonymity is protected/mostly protected are confident that there won't/might not be negative consequences.
- In general, many employees believe that discussing mental health issues would have higher negative consequences as compared to discussing physical health issues
Suggestions: Companies could formulate policies that maintain employee anonymity to encourage a healthy workplace environment open to discussing mental and physical illness.
Willingness vs Company Benefits
Employees suffering from mental health disorders might shy away from discussing about it if they feel it is not professional to talk about it at the workplace. So it is required that their employers provide a formal stage for them to discuss their mental health disorders in order to function upto their potential. Companies often wish to provide benefits to hire and retain their employees and hence might be interested in knowing if they can help their employees tackle any problems they face at workplace including their health. This is done through health care packages which cover employee wellbeing. However, these packages often ignore mental health disorders, which infact can be real struggle for the ones affected by it. Studying the data we have can provide us insights about whether including mental health disorder related benefits can help employees feel comfortable at their workplace. Such insights can also help employees decide about their next workplace if they wish to move to their next jobs.
Key Inferences/Insights:
- Employees tend to be willing to discuss their mental health issues more often when their companies provide mental health support in the health care package.
- There has been an increase in the percentage of companies offering mental health support from year 2016 to 2019. This shows that more companies are becoming aware about providing mental health care benefits.
Factors affecting work environment for people with mental health issues
Factors vs. Perception of Consequences
Effects of factors on perception of negative consequences discussing mental health
Key Inferences/Insights:
- The most impactful feature on perception of consequence was the availability of sick leave being easy, as it tended to have the 1st or 2nd highest correlation with a "none" response out of all factors.
- While resources and knowledge of mental health care options decreased perceptions of consequences, they were not as impactful as direct company policies, such as sick leave and anonymity.
- There is a positive correlation between no perception of negative consequences with mental and with physical health, suggeting that workplaces that care about physical health also tend to care more abbout mental health too.
Challenges and Issues
Although the data source was consistent, there were some problems associated with data consistencies across data for all three years. To do justice to the visulaizations, we point out some of them here along with our efforts to mitigate the issues to make the visualization as warranted as possible.
- Missing Data: The data was presented in '.csv' format and seemed to have consitsted of many missing values. Wherever required, some of the data was extrapolated by either the mean/median value of that particular row. For some visualization, where the data couldn't be extrapolated, the rows were dropped keeping in mind that this wouldn't cause any low-data bias.
- Free-filled Data:The data was collected without pre-defined possible field values for each column. This has led to many different field values for something that represent same original value. For instance, in 2016 data, there are 70 unique genders. In such scenarios, the genders were grouped while respecting the participants' answers. The columns having custom responses were dropped because those are difficult to analyze without going through each response manually.
- Missing columns: Some important columns were missing altogether in a particular year's dataset. For instance, the type of disorder was completely missing in 2014's data. This has led us to completely ignore this data in particular visualization for trend analysis. In the 2019 data, there was no column for perception of negative consequences, so instead, although different but a similar column was used to infer the data by taking the inverse of the responses for whether participants would be willing to talk to employers about mental health issues.
- Data Skewness:The Data isn't well distributed across all age groups, states and company sizes. This creates some kind of biases in the visualizations. To avoid the same, percentages are reported instead of absolute counts to compare data across categories. However, some biases are inevitable.
Conclusion
Mental well is a pressing issue, especially in a high-pressure setting of the IT industry in the USA. Using the OSMI surveys, the trends and practices of the tech industry for the past 3 years were revealed. These results form a solid base for analyzing the entire system and adopting them while finding solutions for inducing a healthy and welcoming workplace environment. Opening up about the mental conditions is the first step towards mitigating the effects of the illness and thus all the stakeholders must act in a way to create an industry supportive of these conditions. Following are some suggestions based on the results of studying the visualization that could be adopted:
- Mental Health communities and volunteers could address issues of mood and anxiety disorders and come up with solutions
- Tech companies could do their bit by organize counselling session for their employees encouraging them to open up their mental conditions
- Considering the mass employee opinions, the companies could add policies to protect workers such as anonymity and sick leave
- Smaller companies should provide more mental health benefits and packages to their employees
- The larger companies still not working towards the cause of mental well being should incorporate policies to support their employees
- In general, all the stakeholder need to set up a stage for employees to talk about mental health issues